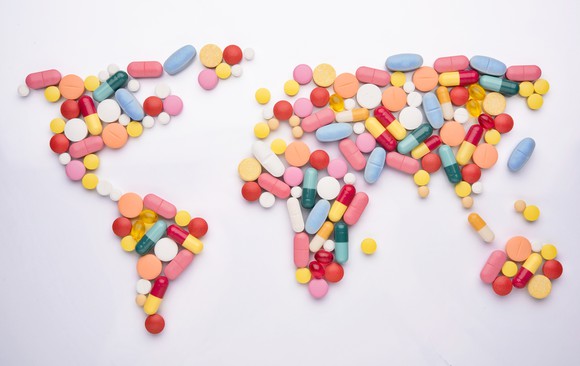
Pharmaceuticals are one of the largest industries on the planet, and certainly one of the most profitable. These huge companies are dealing with some impressive numbers, and the average person probably has no idea of the true depth and value of Big Pharma. Here are a few statistics about Big Pharma that you probably didn’t know.
1. Global Revenue
The annual revenue brought in by the global pharmaceutical industry is roughly $1.05 trillion. That number, for comparison, is just about 25 percent of the entire budget of the United States federal government in 2016.
2. North American Dominated
About half of the global revenue brought into the industry is taken from Canada and the United States. That comes to about $515 billion. Such a high disparity is strange since those two countries only comprise about 7 percent of the world’s population, yet they are buying half the drugs.
3. Profit Margins
Forbes estimated that the healthcare technology sector would enjoy profit margins of 21 percent in 2015. That makes the pharmaceutical industry the most profitable industry on the planet, especially when the profits from both generic and major brands are considered. Certain companies with a higher market share are leading the industry to such high profit margins.
4. Stock Return
In the last 10 years, the 10 biggest pharmaceutical companies have experienced stock returns that averaged at 88 percent. This was mostly led by a few of the larger biotech companies at the top of the index, but the remaining companies still saw returns nearing the 50 percent mark.
5. Investments
The pharmaceutical industry invested nearly $60 billion in R&D in the year of 2015, which was an increase of about $5 billion from the year before. The National Science Foundation estimated the pharmaceutical industry spent roughly 20 percent of the entire national R&D budget in 2011, and that number is expected to rise as the industry continues to thrive.
6. New Drugs
There are currently 7,000 new drugs being developed throughout the global pharmaceutical industry. Many of those drugs are being designed to combat cancer or neurological disorders, and the remaining drugs are nearly all the first of their type.
7. Drug Approval Rate
In 2015, the FDA only approved 45 new drugs for distribution to the general public. However, that year represented the second highest number of drugs ever approved in one year. The highest number of approvals came during 1996. That year saw the approval of 53 new drugs.
8. New Drug Development Cost
It costs a pharmaceutical company about $2.6 billion to develop a new drug. The majority of that cost includes the cost of the drugs that failed during the process. The average cost to produce a single drug has nearly quadrupled since the 1980s.
9. Stringent Trials
Only 12 percent of all drugs that are allowed to reach clinical trials are ever approved. Some estimates actually put that number lower than 12 percent, which is entirely possible. During one sixteen year period, the FDA only approved four drugs to treat Alzheimer’s disease of the 123 that were developed.
10. Advertising
The Nielson television company estimates that a little over $5 billion was spent on advertising prescription drugs in 2015. Television advertisements made up the majority of the cost, and only a handful of drugs were featured in those ads.
11. Employees
There are 854,000 people working directly for the pharmaceutical industry in the United States alone. Their industry has been shown to support about 4.4 million jobs throughout the country, including vendors and suppliers.
12. Patent Cliff
Over the next two years, several drugs are going to lose their patents, which means generic competition will flourish. The value of the drugs losing patents before 2018 is over $64 billion.
Mark Sadaka from Pharma Watch Dog, the leading Drug Injury Attorney, has a national practice and works with clients from New York to Alaska.
