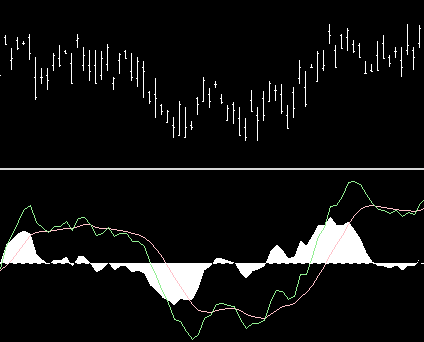
Foreign exchange traders use two basic types of analysis to determine which assets they buy and sell everyday: fundamental and technical. Fundamental analysis involves studying the underlying mood of the market and the activity of other investors and traders, whereas technical analysis is based upon the examination of past price behavior. Investors who perform technical analysis assume that historical price trends of a particular asset or asset class will determine future price action.
Technical Analysis and Forex
Technical analysis is especially useful in Forex trading because of the high volume of trading activity and the 24 hour nature of the market. There are many data points to analyze thanks to this high volume atmosphere, which increases the ability of technical analysis tools like charts and time graphs to predict future price points of assets. Seasoned technical analysts simplify the market’s machinations by choosing to study asset price above all else. They believe that prices move in trends, that trends are predictable and caused by patterns (called “signals” in insider lingo) and that market fundamentals are reflected in and encapsulated by price movement.

Technical Analysis Tools
Traders use mathematical representations of trading data to help them identify the ideal entry and exit points for a particular trade. These representations or models track trends over time and can help demystify certain aspects of these trends, such as their relative strength or persistence. Traders use bar graphs and candlestick charts to determine the direction and strength of signals. Bar graphs are very basic and simply show the movement of price action over time — each bar represents a period of time. Candlestick charts break bar graph data down into more detailed data points. High and low prices for particular time periods are graphed in candlestick charts, making it easier to traders to view price activity within a time period as opposed to movement between time periods.
Why are Trends so Important?
The main goal of technical analysis in Forex is to determine the direction of capital movement and measure its sustainability. This is because identifying price inconsistencies, which is a major component of other forms of trading, is mostly useless in Forex investing. Large Forex trading firms have computer systems that are programmed to spot price inconsistencies in currency pairs and immediately react. This computing activity diminishes the individual trader’s role in creating asset price movement. Savvy Forex traders on AlfaTrade or other trading websites use technical analysis to follow currency pair trends instead of focusing in on minor inconsistencies. Taking a long view of the market can help traders reject day to day fluctuations and find big picture trends.
Technical Analysis Indicators
We have already mentioned trends ad nauseam, but for good reason: they are the most important indicator used by technical analysts to determine future price. Within trends, analysts monitor different indicators that give them clues as to the direction and quality of the trend. Strength is measured by analyzing market intensity, mainly by determining the volume of trades that are revolving around a single asset or pairing. Volatility is based upon day to day fluctuations in the market price and is used to determine whether price will soon change or is destined to plateau temporarily. Momentum is analyzed in order to determine if a trend is ending or beginning. When analyzed alongside price, momentum can give traders a good idea whether a price rise or decline is sustainable or a mere blip on the radar.
Technical analysis is an important part of Forex trading, and traders will have a difficult time profiting from Forex if they disregard the discipline entirely.
