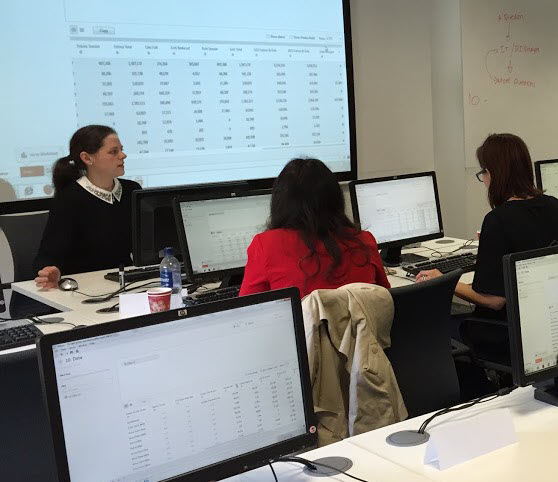
There are some analytics skills which are rated as very important and hard to learn and there are others which are not. This happens in every field of technology or even academia. There is a thing we keep forgetting that when we learn a technology to achieve something, may be a better job or a promotion, we temporarily get back to the academic days. A teacher always brings a lot more to your disposal than free material on the web. Have you already sensed that I am trying to present a critique of the tendency to learn Tableau through the internet for free? I am not against learning through the internet, it is a great way to enhance your knowledge but might as well not be enough.

Tableau is a rich platform
Yes, the learning curve for Tableau is easier than most analytics tools. That is one of the main reasons of it being so famous. But there are some concepts of business intelligence related to this tool that need to be learnt in depth.
- What to use, to what extent and when? These are questions that should be answered during an excellent tableau training.
- Concepts of colour coding a presentation, making different charts to the right end.
- Using the analytical abilities to good effect.
- Integrating results found through R programming.
All comes as a part of the Tableau training. So, basically it is not only about Tableau but also about learning to apply visualization in a certain situation.
Why does it count?
The principal purpose of data analytics is to squeeze information out of data and turn that information into actionable insights. This process owes a lot to storytelling for its successful implementation. A communicative platform is need which can be shared by the members of the analytics and executive teams. Data visualization works as this platform. Tableau is a great way to lit up this platform with cool looks and understandable projections.
Why Tableau?
We have already been talking about this throughout the article but one particular point deserves some extra stress.
Tableau is not a great computational tool but it does its own bit very fast and very effectively. You can get a decent presentation done merely by pushing the data in, it does a great deal automatically. When you put your knowledge into it, you get really potent results.
At the end of the day it is all about convincing the other person about the importance of a certain change that has to occur. The more convincing your visualization is the better the chances that some action will be taken. You cannot really project the future with Tableau but you can definitely analyse the history to identify the areas of strength and weakness.


